- Controls
 The structure view can be manipulated with the following controls:
Leftclick + Mousemove: Rotate
Scroll: Zoom
Rightclick + Mousemove: Move
Shift+Scroll: Adjust clipping-plane
Ctrl+Leftclick: Select residue
- Surface
 The surface representation can be switched on and off to reveal or hide the cartoon representation via this button.
 The current camera view can be saved via this button.
- Structure options
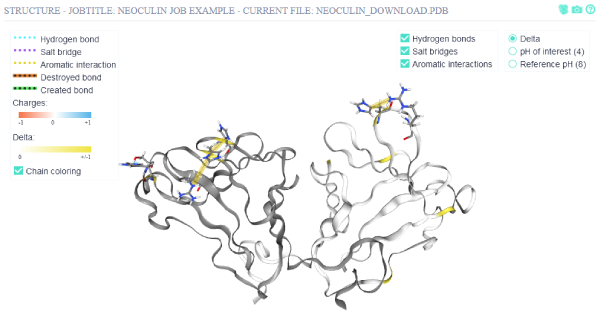
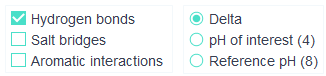 The delta gives the changes in non-covalent interactions when subjecting the protein from reference pH to
the pH of interest. The representation can be chosen for reference pH, pH of interest (blue-positively charged, red-negatively charged)
and delta (yellow, residues which have differential charge between reference pH and pH of interest).
The delta gives the changes in non-covalent interactions when subjecting the protein from reference pH to
the pH of interest. The representation can be chosen for reference pH, pH of interest (blue-positively charged, red-negatively charged)
and delta (yellow, residues which have differential charge between reference pH and pH of interest).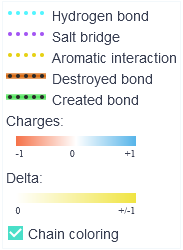 Non-covalent bonds are color-coded for hydrogen bonds (cyan),
salt bridges (magenta) and aromatic interactions (yellow). In delta + cartoon representation,
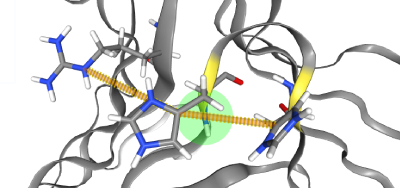
the bonds that are destroyed or created while the protein is subjected to the pH of interest are
additionally represented with a cylinder shape around the striped bond. The destroyed bonds have
a red cylinder around them, whereas the created ones have a green cylinder.
Chains are by default colored in different shades of grey, which can be disabled via the Chain coloring checkbox.
Non-covalent bonds are color-coded for hydrogen bonds (cyan),
salt bridges (magenta) and aromatic interactions (yellow). In delta + cartoon representation,
the bonds that are destroyed or created while the protein is subjected to the pH of interest are
additionally represented with a cylinder shape around the striped bond. The destroyed bonds have
a red cylinder around them, whereas the created ones have a green cylinder.
Chains are by default colored in different shades of grey, which can be disabled via the Chain coloring checkbox.
- Residue selection
 Residues can be selected via Ctrl+Leftclick which will reveal the selected residue's
non-covalent interactions. Selected residues can be deselected via Ctrl-Leftclicking anywhere but on a residue.
A tooltip will appear when hovering the mouse over the residue.
The residues' chain information is displayed after a colon.
Residues can be selected via Ctrl+Leftclick which will reveal the selected residue's
non-covalent interactions. Selected residues can be deselected via Ctrl-Leftclicking anywhere but on a residue.
A tooltip will appear when hovering the mouse over the residue.
The residues' chain information is displayed after a colon.
- Graph overview
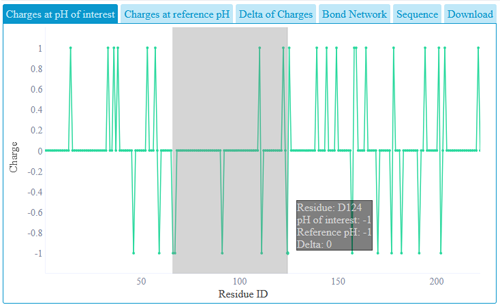 A graph with each residue charge can be seen in the overview part. Zooming can be done
via clicking and holding the mouse at the start of the desired region and moving the mouse towards the end
of the desired region. Zoom can be reset via the "Reset zoom" button or via a doubleclick on the graph.
If the graph is zoomed in, it can be moved by holding Shift and dragging with the left mouse button.
Clicking a residue on the graph will also show the residue in the structure view. Data used in plots can be
downloaded from download link.
A graph with each residue charge can be seen in the overview part. Zooming can be done
via clicking and holding the mouse at the start of the desired region and moving the mouse towards the end
of the desired region. Zoom can be reset via the "Reset zoom" button or via a doubleclick on the graph.
If the graph is zoomed in, it can be moved by holding Shift and dragging with the left mouse button.
Clicking a residue on the graph will also show the residue in the structure view. Data used in plots can be
downloaded from download link.- Bond network
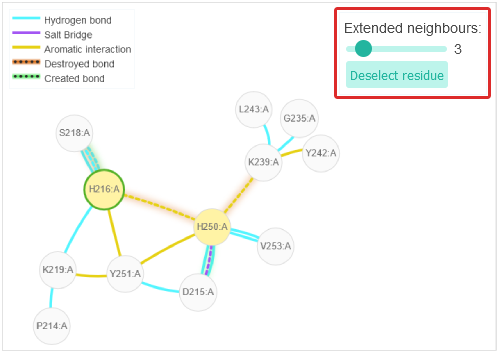 Via the "Extended neighbours" slider one can specify the grades of neighbours that are shown.
The current residue selection can be deselected via the "Deselect residue" button. The bonds of the currently selected residue are shown in a 2D network.
Via the "Extended neighbours" slider one can specify the grades of neighbours that are shown.
The current residue selection can be deselected via the "Deselect residue" button. The bonds of the currently selected residue are shown in a 2D network.The non-covalent bonds of both, pH of interest and reference pH states are represented in the network. If there's a difference between the two states, the bond will be represented via a dotted line instead of a solid line. If a bond is present at pH of interest but not at reference pH it will have a green shadow and will be labeled as "Created" in its tooltip. If the bond is not present in the pH of interest but in the reference pH, it will have the "Destroyed" label in its tooltip and the bond will have a red shadow.
- Sequence
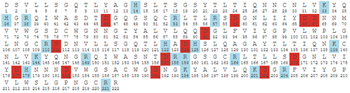 The sequence coloring is dependent on the currently selected radio-button (delta, pH of interest or reference pH)
in the structure view. For pH of interest and reference pH negatively charged residues are shown in red and positively charged residues
are shown in blue. In structure functionality charges and delta are shown in full colors and in sequence functionality charges and delta are shown from pale to
full colors indicating the difference magnitude of the charge or charge change.
Different patches are shown via differently colored bars on the top of the residues in the patch.
Residues can be selected via clicking on them, which will also select the residue in the other overview
graphs and in the structure view.
The sequence coloring is dependent on the currently selected radio-button (delta, pH of interest or reference pH)
in the structure view. For pH of interest and reference pH negatively charged residues are shown in red and positively charged residues
are shown in blue. In structure functionality charges and delta are shown in full colors and in sequence functionality charges and delta are shown from pale to
full colors indicating the difference magnitude of the charge or charge change.
Different patches are shown via differently colored bars on the top of the residues in the patch.
Residues can be selected via clicking on them, which will also select the residue in the other overview
graphs and in the structure view.- Patches
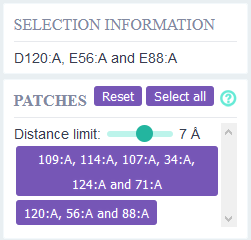 Residues that have differential charge between reference pH - pH of interest and are in close proximity
(2-10 Ångstrom) are defined as pH sensitive patches.
The distance threshold for defining whether two residues are in proximity of each other can be adjusted.
When clicking on a patch the residues will be selected in the structure view (green).
The coloring of the other residues will remain the same.
Residues that have differential charge between reference pH - pH of interest and are in close proximity
(2-10 Ångstrom) are defined as pH sensitive patches.
The distance threshold for defining whether two residues are in proximity of each other can be adjusted.
When clicking on a patch the residues will be selected in the structure view (green).
The coloring of the other residues will remain the same.- File selection
 If multiple files have been uploaded, they can be selected via this drop-down menu. For comparing and ranking multiple files we recommend downloading the raw data.
- Data download
 Raw data used in visualization and plots can be downloaded in text format.
- Samples
| PDB structure file | Multiple PDB structure files | Fasta sequence file | Multi sequence fasta file | |
|---|---|---|---|---|
| Sample output links: | ||||
| Sample input downloads: |
- Browser compatibility
| OS | Version | Chrome | Firefox | Edge | Safari |
|---|---|---|---|---|---|
| Windows | 10 | 87 | 83 | 44 | not tested |
| Linux | Ubuntu 20.04 | not tested | 79 | not tested | / |
| Mac | Mojave | 97 | 96 | 97 | 12.1 |
- Raw data
| Column Title | Description |
|---|---|
| SessionID | This is the key that is generated to access the results |
| JobTitle | The job title given when uploading the file |
| Protein Name | The pdb filename |
| Sequence | The sequence extracted from the pdb file |
| PDB IDs | These are the ids given in the pdb file. The chain of the residue id will be given after the colon (Residue 4 in chain A will be given as "4:A"). The residue ids and their respective chain ids are delimited via a semicolon. |
| pH of interest | The charges of the residues at the pH of interest are in this row. They are delimited via a semicolon. |
| pH reference | The charges of the residues at the reference pH are in this row. They are delimited via a semicolon. |
| pH delta | The difference between the charges of the residues of the pH of interest and reference pH. They are delimited via a semicolon. |
| Patches (index) | Patches of clustered differentially charged residues. Multiple distance thresholds for the patch definition ranging from 2 Å - 10 Å based on all-atomic inter-residue distances are delimited via a colon. Residues in the same patch are contained in braces ({...}). Residues in the same patch are delimited via a semicolon. The residue numbers are shown as indexes, starting from 0. The residue indexes are a uninterrupted series. |
| Patches (PDB IDs) | Patches of clustered differentially charged residues. Multiple distance thresholds for the patch definition ranging from 2 Å - 10 Å based on all-atomar inter-residue distances are delimited via a colon. Residues in the same patch are contained in braces ({...}). Residues are delimited via a semicolon. The residue numbers are shown as the pdb ids |
| Patch score | The individual patch scores in the same order as the patches from the two preceeding columns. The patch scores for the different distance thresholds are delimited via a colon. The patch scores are the numbers of residues in the patch divided by the total number of residues in the protein. If there are multiple patches, the scores are delimited via a semicolon. |
| Sum patch score | The sum of all individual patch scores. The sum patch scores for the different distance thresholds are delimited via a semicolon. |
| Overall charge score | The sum of the charges of the pH of interest substracted by the sum of charges of the reference pH normalized by the total number of residues in the protein. |
| pH values | The specified pH values of the pH of interest followed by the reference pH, separated through a semicolon. |
| HBonds pH interest (index) | Hydrogen bonds at the pH of interest. Bonds are delimited via a semicolon. A hydrogen bond between two residues is shown via the residues' indexes (uninterrupted series starting at 0) linked through a hyphen. The atoms of the residues in the bond are delimited with a point after the respective residue index. |
| HBonds ref pH (index) | Hydrogen bonds at the reference pH. Nomenclature is the same as for "HBonds pH interest (index)" |
| HBonds Destroyed (index) | Hydrogen bonds that are disappearing when the protein is subjected to the pH of interest compared to the reference pH. Nomenclature is the same as for "HBonds pH interest (index)" |
| HBonds Created (index) | Hydrogen bonds that are appearing when the protein is subjected to the pH of interest compared to the reference pH. Nomenclature is the same as for "HBonds pH interest (index)" |
| Salt bridges and Aromatic interactions | Same principles as the hydrogen bond columns |
| pH values | The pH of interest delimited by a semicolon from the reference pH. |