- Introduction
- Background
These findings were conducted experimentally, patcHwork on the other handy can be used as a starting point to find pH sensitive clusters of residues and residue interactions to rationally plan experiments.
Identification and Modulation of the Key Amino Acid Residue Responsible for the pH Sensitivity of Neoculin, a Taste-Modifying Protein. Ken-ichiro Nakajima, Kanako Yokoyama, Taichi Koizumi, Ayako Koizumi, Tomiko Asakura, Tohru Terada, Katsuyoshi Masuda, Keisuke Ito, Akiko Shimizu-Ibuka, Takumi Misaka, and Keiko Abe. PLOS One 2011 Apr;6(4):e19448
- File upload
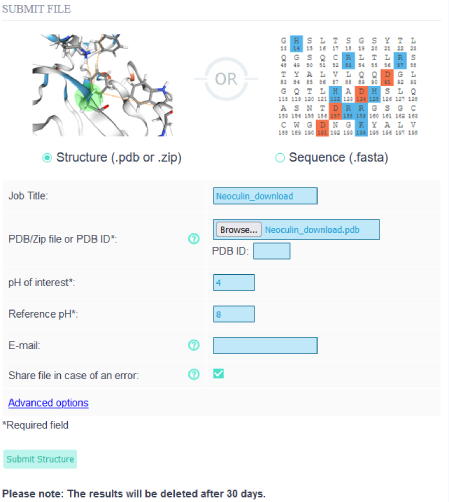 Before uploading the neoculin pdb file (PDBID: 2D04) and the first two chains (A and B) were kept and the rest in the file were deleted, as the file contains multiple heterodimeric pairs.
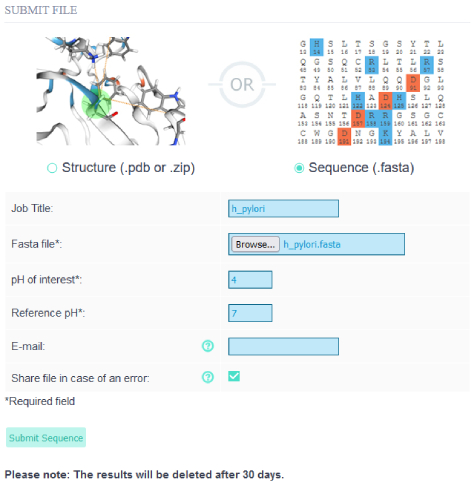
On the "Upload" site the user may select to upload a protein structure or a sequence. In this case since there is a pdb file, the Structure radio button is selected. The analysis can be named in the job title input field. For the reference pH, 8 can be entered and the pH of interest is the pH at which neoculin exhibits its pH sensitive function, so 4.
Note: Please be sure to only submit files with the .pdb format in the structure submission other formats are not supported.
 After clicking the "Submit structure" button the user will get a personal key which the results can be accessed for up to 30 days.
The user may also click on the link to see the current status of the analysis.
After clicking the "Submit structure" button the user will get a personal key which the results can be accessed for up to 30 days.
The user may also click on the link to see the current status of the analysis.
- Structure analysis
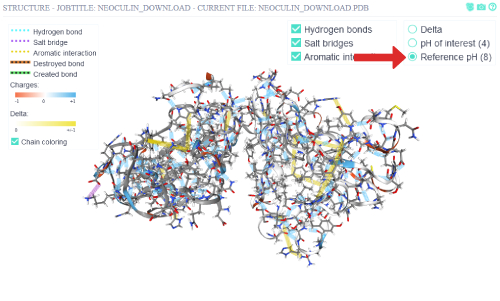 By clicking on the different pH visualization states, the cartoon representation will change its coloring to reflect the residues' charges (blue - positive, red - negative).
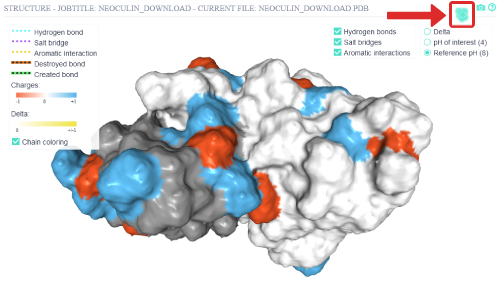 The surface representation can be toggled on and off via the top right button.
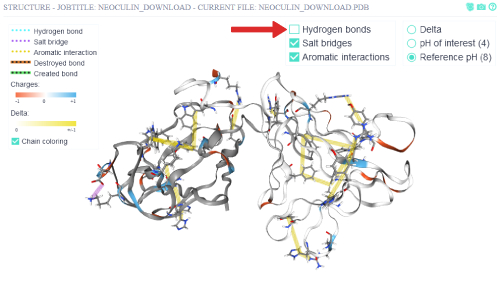 To get a more uncluttered view of the non-covalent inter-residue interactions, the hydrogen bonds are toggled off.
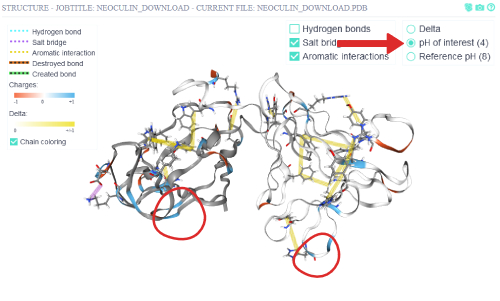 Via switching to the pH of interest (4), the non-covalent inter-residue interactions at that pH are shown.
Some non-covalent interactions disappear in this pH compared to the reference pH (8).
Via switching to the pH of interest (4), the non-covalent inter-residue interactions at that pH are shown.
Some non-covalent interactions disappear in this pH compared to the reference pH (8).
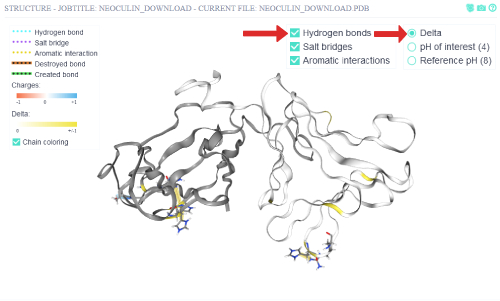 The delta view is switched on to view the residue interactions that change from the reference pH to the pH of interest. Those are the interactions
that are destroyed or created when the protein is subjected to the pH of interest. The hydrogen bonds are also switched on again to see all non-covalent interactions that are affected.
There are in total 7 residues which show changing non-covalent interactions. Of those 5 are involved in changing aromatic interactions and the other 2 in a changing hydrogen bond.
One of those residues participates in two aromatic interaction changes,
so this might be a residue of particular importance if one would wish to disrupt the protein's pH specific effect.
The delta view is switched on to view the residue interactions that change from the reference pH to the pH of interest. Those are the interactions
that are destroyed or created when the protein is subjected to the pH of interest. The hydrogen bonds are also switched on again to see all non-covalent interactions that are affected.
There are in total 7 residues which show changing non-covalent interactions. Of those 5 are involved in changing aromatic interactions and the other 2 in a changing hydrogen bond.
One of those residues participates in two aromatic interaction changes,
so this might be a residue of particular importance if one would wish to disrupt the protein's pH specific effect.
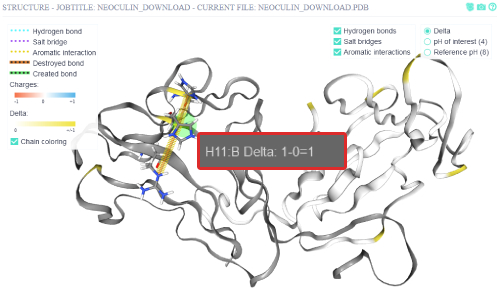 A tooltip appears when the mouse is over the residue. The corresponding chain of the residue is written after the colon.
Via Ctrl+left clicking on the residue, the residue in question is selected, and only its bonds are shown.
The residue can be deselected via Ctrl-Left clicking anywhere but on a residue in the structure view window.
The residue that is selected is the residue H11:B, which is His11 of the NBS (chain B), the same
residue that Nakajima et al. found to be the main pH sensitive switch for neoculin activity modulation.
A tooltip appears when the mouse is over the residue. The corresponding chain of the residue is written after the colon.
Via Ctrl+left clicking on the residue, the residue in question is selected, and only its bonds are shown.
The residue can be deselected via Ctrl-Left clicking anywhere but on a residue in the structure view window.
The residue that is selected is the residue H11:B, which is His11 of the NBS (chain B), the same
residue that Nakajima et al. found to be the main pH sensitive switch for neoculin activity modulation.
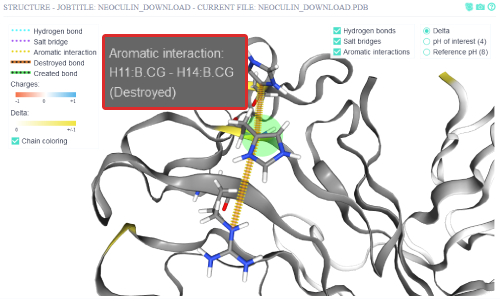 A tooltip with additional information appears when the mouse is hovered over the affected inter-residue interaction.
The aromatic interaction between His11:B and His14:B is destroyed when the protein is put into a low pH (4) medium.
This interaction corresponds to the interaction between His11 and His14 that Nakajima et al. suggested to be of importance.
A tooltip with additional information appears when the mouse is hovered over the affected inter-residue interaction.
The aromatic interaction between His11:B and His14:B is destroyed when the protein is put into a low pH (4) medium.
This interaction corresponds to the interaction between His11 and His14 that Nakajima et al. suggested to be of importance.
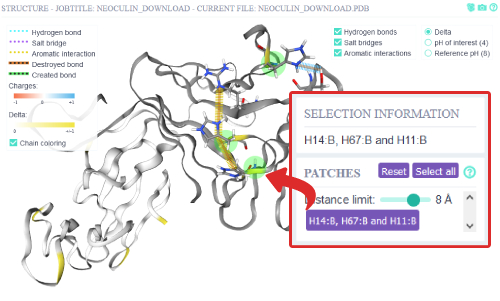 Residues that have differential charge between reference pH - pH of interest and are in close proximity
(8 Ångstrom) are defined as pH sensitive patches. If there are any patches of differentially charged residues they
will be displayed and clickable. When a patch is selected, the structure residue selection is automatically
updated as well as the overview graphs. The two residues His11:B and His14:B are also contained in the patch.
Residues that have differential charge between reference pH - pH of interest and are in close proximity
(8 Ångstrom) are defined as pH sensitive patches. If there are any patches of differentially charged residues they
will be displayed and clickable. When a patch is selected, the structure residue selection is automatically
updated as well as the overview graphs. The two residues His11:B and His14:B are also contained in the patch.
- Overview analysis
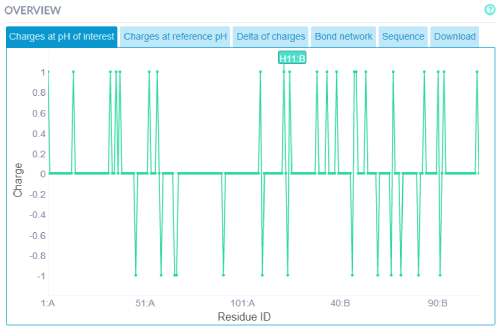 Additionally, the same information from the 3D structure view may be accessed via 2D graphs. For instance graphs
with the residues charges at the 3 states (reference pH, pH of interest and delta) can be viewed. Selecting a residue
on the graph with also select the residue in the structure view and vise-versa.
Additionally, the same information from the 3D structure view may be accessed via 2D graphs. For instance graphs
with the residues charges at the 3 states (reference pH, pH of interest and delta) can be viewed. Selecting a residue
on the graph with also select the residue in the structure view and vise-versa.
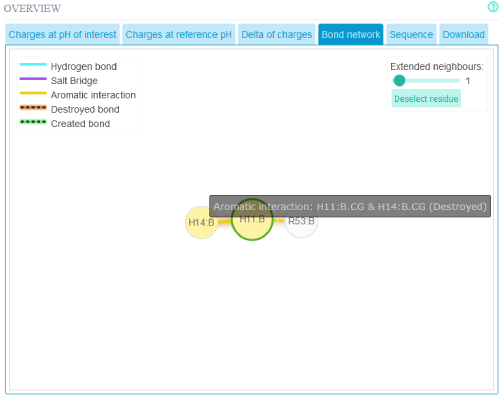 The Interaction network may also be viewed in 2D. Interactions that are changing have a appropriately colored shadow to indicate
the effect the pH change has on the interaction. If one wishes to see the whole protein's residue interaction map one can click on the button
"Deselect residue"
The Interaction network may also be viewed in 2D. Interactions that are changing have a appropriately colored shadow to indicate
the effect the pH change has on the interaction. If one wishes to see the whole protein's residue interaction map one can click on the button
"Deselect residue"
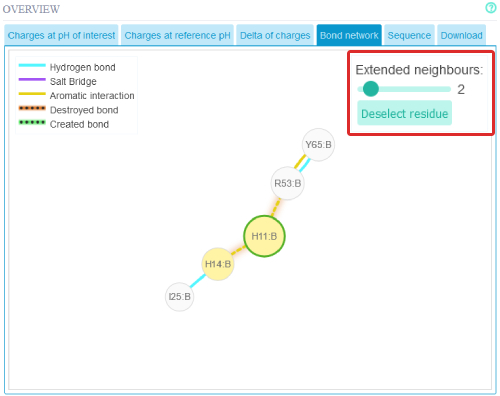 Extending the interaction network can be done via the slider.
 The sequence of the protein with the residue charges of the currently selected pH state (reference pH, pH of interest and delta) in
the structure view can also be accessed. The colored bars above residues mean that they are in a patch in the protein structure.
The sequence of the protein with the residue charges of the currently selected pH state (reference pH, pH of interest and delta) in
the structure view can also be accessed. The colored bars above residues mean that they are in a patch in the protein structure.
- Sequence upload
 As a demo for the multiple sequence (FASTA) submission functionality of patcHwork,
we wanted to investigate the pH sensitivity of previously characterized H. pylori
membrane proteins with GO term:0005886 - plasma membrane, which consisted of total 29 proteins.
As a demo for the multiple sequence (FASTA) submission functionality of patcHwork,
we wanted to investigate the pH sensitivity of previously characterized H. pylori
membrane proteins with GO term:0005886 - plasma membrane, which consisted of total 29 proteins.
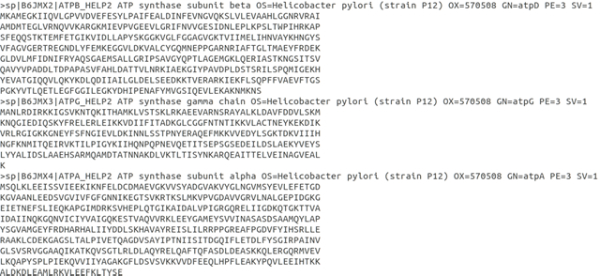
 To be able to submit multiple sequences to patcHwork we prepared a single FASTA file including all 29 proteins' amino acid sequences.
Then we uploaded the FASTA file to the patcHwork by choosing pH of interest as 4 and reference pH as 7.
To be able to submit multiple sequences to patcHwork we prepared a single FASTA file including all 29 proteins' amino acid sequences.
Then we uploaded the FASTA file to the patcHwork by choosing pH of interest as 4 and reference pH as 7.
- Sequence output
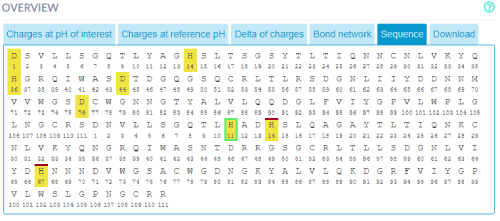
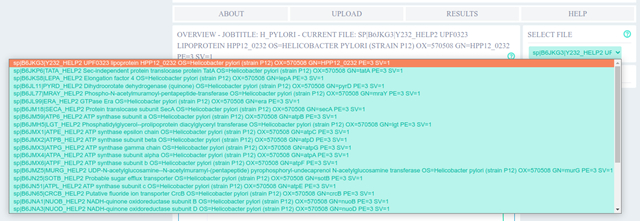 In few seconds we got the pH sensitivity analysis of each protein for pH 4 and pH 7, which can be selected from the drop down menu.
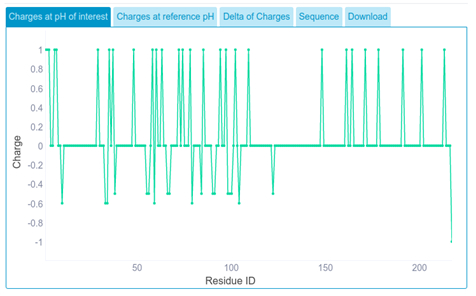 For each protein sequence submitted, we get the partial amino acid charge for the pH of interest.
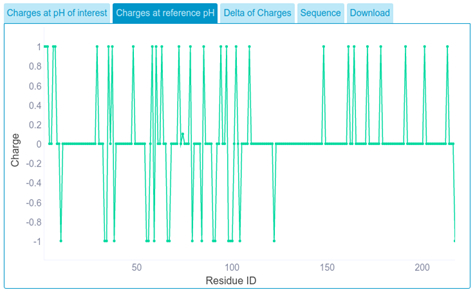 We get the partial amino acid charge at reference pH.
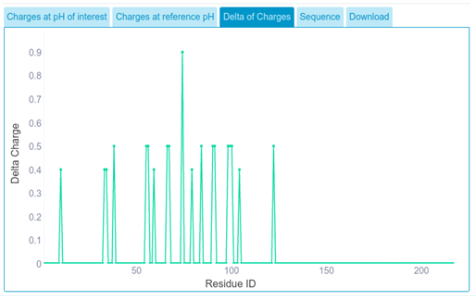 We get delta of charges, which indicates residues that have differential charge between reference pH and pH of interest.
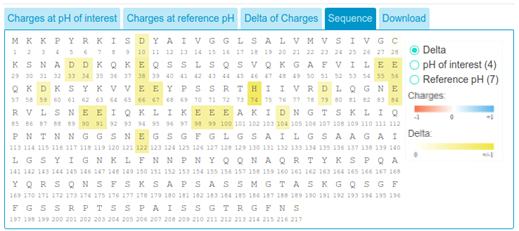 Delta of charges can also be visualized on the sequence, pale to dark yellow coloring indicate the magnitude of the differential charge between reference pH and pH of interest.
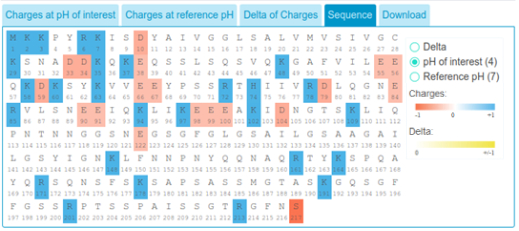 Additionally, charges of amino acids in reference pH and pH of interest can be respectively visualized. Here, blue indicates positively
charged residues while red indicates negatively charged residues. Darker blue and red colors indicate bigger differential charges.
Additionally, charges of amino acids in reference pH and pH of interest can be respectively visualized. Here, blue indicates positively
charged residues while red indicates negatively charged residues. Darker blue and red colors indicate bigger differential charges.
- Sequence ranking
 Finally, results of all analyses used in plots for each protein can be downloaded in a single file.
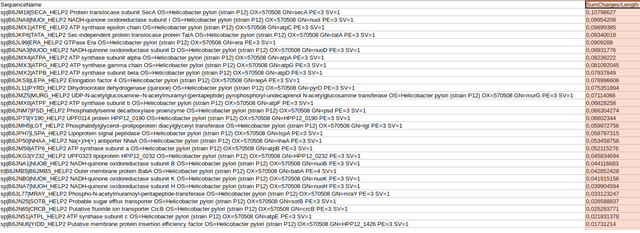 In the provided spreadsheet output, submitted sequences can be ranked according to
(sum of delta charges of a protein / total length of protein) calculation,
which can help to identify pH sensitive proteins for user given pH values.
In the provided spreadsheet output, submitted sequences can be ranked according to
(sum of delta charges of a protein / total length of protein) calculation,
which can help to identify pH sensitive proteins for user given pH values.